

Varex Imaging Corp
$ 11.03
4.75%
11 Jun - close price
- Market Cap 450,862,000 USD
- Current Price $ 11.03
- High / Low $ 11.12 / 10.45
- Stock P/E N/A
- Book Value 11.38
- EPS -2.00
- Next Earning Report 2026-07-30
- Dividend Per Share N/A
- Dividend Yield 0 %
- Next Dividend Date -
- ROA 0.03 %
- ROE -0.16 %
- 52 Week High 14.56
- 52 Week Low 6.76
About
Varex Imaging Corporation designs and manufactures X-ray imaging components. The company is headquartered in Salt Lake City, Utah.
Analyst Target Price
$18.00
Quarterly Earnings
| Mar 2026 | Dec 2025 | Sep 2025 | Jun 2025 | Mar 2025 | Dec 2024 | Sep 2024 | Jun 2024 | Mar 2024 | Dec 2023 | Sep 2023 | Jun 2023 | |
|---|---|---|---|---|---|---|---|---|---|---|---|---|
| Reported Date | 2026-05-07 | 2026-02-10 | 2025-11-18 | 2025-08-07 | 2025-05-08 | 2025-02-06 | 2024-11-19 | 2024-08-01 | 2024-05-02 | 2024-02-06 | 2023-11-14 | 2023-08-01 |
| Reported EPS | 0.21 | 0.19 | 0.37 | 0.18 | 0.26 | 0.07 | 0.19 | 0.14 | 0.16 | 0.06 | 0.45 | 0.37 |
| Estimated EPS | 0.21 | 0.13 | 0.18 | 0.04 | 0.14 | 0.04 | 0.09 | 0.19 | 0.21 | 0.11 | 0.35 | 0.32 |
| Surprise | 0 | 0.06 | 0.19 | 0.14 | 0.12 | 0.03 | 0.1 | -0.05 | -0.05 | -0.05 | 0.1 | 0.05 |
| Surprise Percentage | 0% | 46.1538% | 105.5556% | 350% | 85.7143% | 75% | 111.1111% | -26.3158% | -23.8095% | -45.4545% | 28.5714% | 15.625% |
Next Quarterly Earnings
| Jun 2026 | |
|---|---|
| Reported Date | 2026-07-30 |
| Fiscal Date Ending | 2026-06-30 |
| Estimated EPS | 0.2 |
| Currency | USD |
Next Dividend Records
| Dividend per share (year): | - |
| Dividend Yield | - |
| Next Dividend Date | - |
| Ex-Dividend Date | - |
Recent News: VREX

2026-06-08 13:55:00
Wall Street analysts are forecasting a potential 78.4% upside for VAREX IMAGING (VREX), with a mean price target of $18. This optimism is further supported by positive earnings estimate revisions and a Zacks Rank #2 (Buy) rating. Despite the encouraging outlook, the article advises investors to approach price targets with skepticism, using them as a starting point for further research rather than the sole basis for investment decisions.
2026-06-07 14:26:00
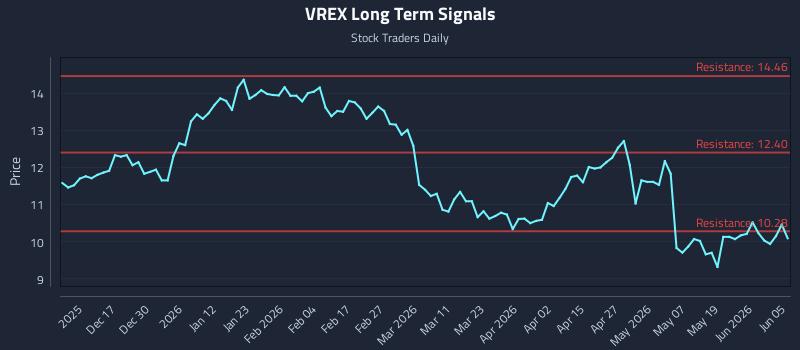
This article analyzes Varex Imaging Corporation (NASDAQ: VREX) using AI models, indicating a near-term neutral sentiment but mid and long-term strength. It provides three distinct AI-generated trading strategies—Position Trading, Momentum Breakout, and Risk Hedging—tailored for different risk profiles. The analysis highlights current price positioning signals and support/resistance levels across various time horizons.
2026-06-04 07:08:57
Varex Imaging Corp (VREX) is currently considered undervalued, with a forward PE ratio of 10.89 compared to its five-year average of 20.29. Its fair price is estimated to be between $14.11 and $23.99, indicating it is undervalued by 28.07% relative to its current price of $10.15. Despite robust revenue growth, its P/S ratio of 0.46 is significantly above the industry average, which is deemed unsustainable.
2026-06-03 20:40:30
Varex Imaging Corporation (VREX) management has outlined stable growth supported by new annual guidance and three key drivers: expansion in India, cargo inspection, and photon counting technology. The company also highlights AI and digital infrastructure as crucial enablers, with recent debt refinancing providing strategic flexibility for future initiatives. This information is based on an audio transcript from the Jefferies Global Healthcare Conference 2026.
2026-05-28 18:40:59
Varex Imaging Corporation announced it will present at the Jefferies Global Healthcare Conference in New York on Wednesday, June 3, 2026, at 3:10 PM ET. The presentation will be webcast and accessible via links provided by Business Wire and Varex's website. Varex is a leading innovator and manufacturer of X-ray imaging components for medical, industrial, and security applications.
2026-05-28 12:10:35
Varex Imaging Corporation (Nasdaq: VREX) announced that its management will participate in a fireside chat at the Jefferies Global Healthcare Conference on June 3, 2026, at 3:10 pm ET. The presentation will be webcast and accessible via Varex's website. Varex is a leading manufacturer of X-ray imaging components for medical, industrial, and security applications.

