

Vista Oil Gas ADR
$ 66.08
1.54%
10 Apr - close price
- Market Cap 6,908,168,000 USD
- Current Price $ 66.08
- High / Low $ 66.78 / 64.42
- Stock P/E 10.46
- Book Value 24.08
- EPS 6.22
- Next Earning Report 2026-04-22
- Dividend Per Share N/A
- Dividend Yield 0 %
- Next Dividend Date -
- ROA 0.14 %
- ROE 0.35 %
- 52 Week High 79.20
- 52 Week Low 31.63
About
Vista Oil & Gas, SAB de CV, is dedicated to the exploration and production of oil and gas in Latin America. The company is headquartered in Mexico City, Mexico.
Analyst Target Price
$84.62
Quarterly Earnings
| Dec 2025 | Sep 2025 | Jun 2025 | Mar 2025 | Dec 2024 | Sep 2024 | Jun 2024 | Mar 2024 | Dec 2023 | Sep 2023 | Jun 2023 | Mar 2023 | |
|---|---|---|---|---|---|---|---|---|---|---|---|---|
| Reported Date | 2026-02-26 | 2025-10-22 | 2025-07-09 | 2025-04-22 | 2025-02-18 | 2024-10-23 | 2024-07-11 | 2024-04-24 | 2024-02-20 | 2023-10-24 | 2023-07-13 | 2023-04-24 |
| Reported EPS | 0.815 | 1.48 | 10.2536 | 15.5339 | 4.6994 | 1.66 | 1.39 | 0.5 | 1.32 | 0.82 | 0.52 | 1.32 |
| Estimated EPS | 1.15 | 1.17 | 1.1 | 15.979 | 18.9468 | 1.31 | 1.26 | 0.89 | 1.04 | 1.16 | 0.87 | 0.99 |
| Surprise | -0.335 | 0.31 | 9.1536 | -0.4451 | -14.2474 | 0.35 | 0.13 | -0.39 | 0.28 | -0.34 | -0.35 | 0.33 |
| Surprise Percentage | -29.1304% | 26.4957% | 832.1455% | -2.7855% | -75.1969% | 26.7176% | 10.3175% | -43.8202% | 26.9231% | -29.3103% | -40.2299% | 33.3333% |
Next Quarterly Earnings
| Mar 2026 | |
|---|---|
| Reported Date | 2026-04-22 |
| Fiscal Date Ending | 2026-03-31 |
| Estimated EPS | 2.42 |
| Currency | USD |
Next Dividend Records
| Dividend per share (year): | - |
| Dividend Yield | - |
| Next Dividend Date | - |
| Ex-Dividend Date | - |
Recent News: VIST

2026-04-09 21:08:34
This article identifies Vista Energy, S.A.B. de C.V. (NYSE:VIST) as one of the most profitable natural gas stocks. Analysts from UBS and Goldman Sachs have recently raised their price targets and maintained Buy ratings for VIST, citing strong production growth and high-quality assets in Argentina’s Vaca Muerta formation. The company's disciplined growth strategy and focus on unconventional resources position it well to benefit from increasing global energy demand.
2026-04-08 00:41:26
This article evaluates Vista Energy, S.A.B. de C.V. (VIST) and YPF Sociedad Anonima (YPF) as potential value stock investments using Zacks Rank and Style Scores. VIST is highlighted with a Zacks Rank #1 (Strong Buy) and a Value grade of A, demonstrating attractive P/E, P/B, and P/CF ratios compared to its industry. Similarly, YPF also holds a Zacks Rank #1 (Strong Buy) and an A for Value, showing favorable P/E, PEG, and P/B ratios.
2026-04-07 08:40:35
This article evaluates Vista Energy, S.A.B. de C.V. - Sponsored ADR (VIST) and YPF Sociedad Anonima (YPF) as potential value investment opportunities. Both companies hold a Zacks Rank #1 (Strong Buy) and an "A" grade for Value, with VIST showing attractive P/E, P/B, and P/CF ratios compared to industry averages. The article suggests these metrics indicate both stocks are trading below their intrinsic value, presenting compelling opportunities for value investors.
2026-04-02 22:10:41
Vista Energy's Argentine subsidiary, Vista Energy Argentina S.A.U., announced it has priced U.S.$500 million of 7.875% senior notes due in 2038 under New York law to institutional investors. This issuance is part of a larger U.S.$4 billion debt program, aiming to secure long-term capital for its Argentine oil and gas operations. Despite strong profitability, TipRanks' AI Analyst has a "Neutral" rating on VIST stock due to negative free cash flow, weaker cash conversion, and higher leverage, though technicals are supportive.
2026-04-02 06:14:00
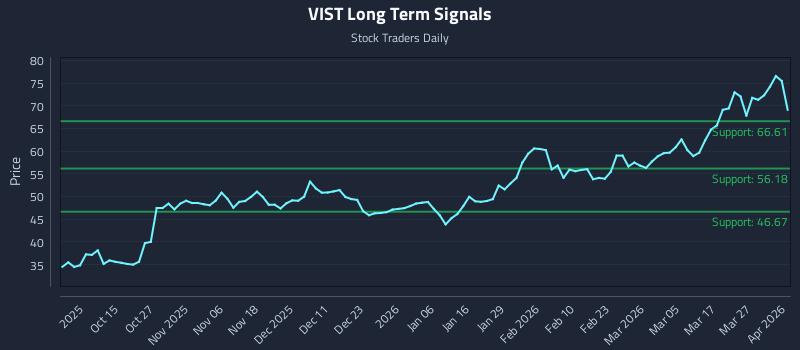
This article from Stock Traders Daily provides a liquidity mapping analysis for Vista Energy (VIST), highlighting strong sentiment across all horizons supporting an overweight bias. It outlines institutional trading strategies including position, momentum breakout, and risk hedging strategies with specific entry zones, targets, and stop losses. The analysis also details multi-timeframe signal strengths, support, and resistance levels.

2026-04-01 20:41:03
Vista Energy, through its main subsidiary Vista Energy Argentina S.A.U., successfully priced $500 million of 7.875% senior notes due 2038. This offering, governed by New York law and conducted under Rule 144A and Regulation S, is expected to close on April 8, 2026. The notes have an average weighted life of eleven years, with principal repayments scheduled for the tenth, eleventh, and twelfth anniversaries of issuance, providing long-term financing.

