

Transcontinental Realty Investors
$ 37.35
4.92%
04 Mar - close price
- Market Cap 389,806,000 USD
- Current Price $ 37.35
- High / Low $ 37.35 / 36.84
- Stock P/E 69.42
- Book Value 97.04
- EPS 0.65
- Next Earning Report 2026-03-19
- Dividend Per Share N/A
- Dividend Yield 0 %
- Next Dividend Date -
- ROA N/A %
- ROE 0.01 %
- 52 Week High 59.65
- 52 Week Low 26.96
About
Transcontinental Realty Investors, Inc., a Dallas-based real estate investment company, has a diverse portfolio of capital real estate located throughout the United States, including apartments, office buildings, shopping centers, and urbanized and undeveloped land.
Analyst Target Price
N/A
Quarterly Earnings
| Sep 2025 | Jun 2025 | Mar 2025 | Dec 2024 | Sep 2024 | Jun 2024 | Mar 2024 | Dec 2023 | Sep 2023 | Jun 2023 | Mar 2023 | Dec 2022 | |
|---|---|---|---|---|---|---|---|---|---|---|---|---|
| Reported Date | 2025-11-06 | 2025-08-07 | 2025-05-07 | 2025-03-20 | 2024-11-07 | 2024-08-08 | 2024-05-09 | 2024-03-21 | 2023-11-09 | 2023-08-10 | 2023-05-11 | 2023-03-23 |
| Reported EPS | 0.08 | 0.02 | 0.0125 | 0.01 | 0.1976 | 0.1734 | -0.2964 | -0.2964 | 0.5152 | 0.0613 | 6.8232 | 6.82 |
| Estimated EPS | None | None | None | 0 | None | None | None | None | None | None | None | None |
| Surprise | 0 | 0 | 0 | 0.01 | 0 | 0 | 0 | 0 | 0 | 0 | 0 | 0 |
| Surprise Percentage | None% | None% | None% | None% | None% | None% | None% | None% | None% | None% | None% | None% |
Next Quarterly Earnings
| Dec 2025 | |
|---|---|
| Reported Date | 2026-03-19 |
| Fiscal Date Ending | 2025-12-31 |
| Estimated EPS | |
| Currency | USD |
Previous Dividend Records
| Jan 1970 | Jan 1970 | Jan 1970 | Jan 1970 | Jan 1970 | Jan 1970 | Jan 1970 | |
|---|---|---|---|---|---|---|---|
| Payment Date | None | None | None | None | None | None | None |
| Amount | $0.18 | $0.18 | $0.18 | $0.15 | $0.15 | $0.15 | $0.15 |
Next Dividend Records
| Dividend per share (year): | - |
| Dividend Yield | - |
| Next Dividend Date | - |
| Ex-Dividend Date | - |
Recent News: TCI
2026-02-27 15:53:22
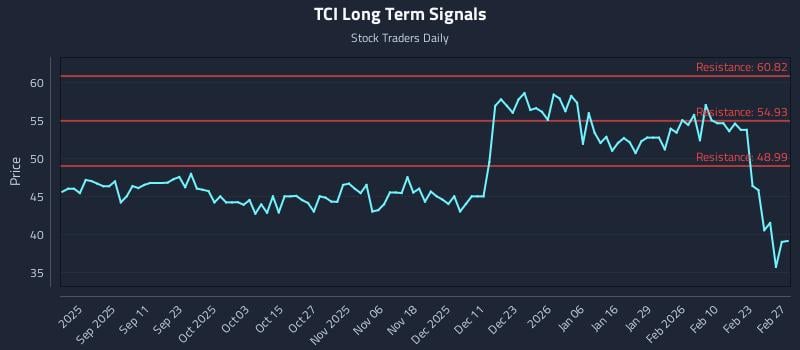
This article provides a precision trading analysis for Transcontinental Realty Investors Inc. (TCI), identifying weak near and mid-term sentiment but a strong long-term outlook. It outlines several AI-generated trading strategies—Position, Momentum Breakout, and Risk Hedging—with specific entry, target, and stop-loss zones. The analysis also includes multi-timeframe signal data, highlighting key support and resistance levels for TCI.

2026-02-18 08:52:23
This article analyzes the valuation of Transcontinental Realty Investors Inc (TCI) using various financial metrics. It indicates that TCI is currently in the "Fair zone" based on its forward PS ratio compared to its five-year average. Key metrics discussed include Price-to-Book ratio, Free Cash Flow yield, and comparison of its P/S ratio against competitors, suggesting that a premium observed might be unsustainable given robust revenue growth.
2026-02-17 09:57:49
Transcontinental Realty Investors (TCI) is a thinly traded, Dallas-based REIT that has been restructuring its portfolio and capital structure, often through asset sales and debt refinancings, which makes its financial profile look different from typical REITs. It is largely overlooked by mainstream Wall Street and appeals to US investors willing to accept low liquidity and high concentration risk, focusing on long-term asset value rather than daily price action or dividends. The company's performance is heavily influenced by SEC filings and idiosyncratic events, requiring in-depth forensic analysis from investors rather than relying on analyst coverage.

2026-02-16 07:55:12
Transcontinental Realty Investors (TCI) is a Dallas-based REIT that primarily invests in multifamily and commercial properties. The company is undergoing a quiet restructuring, focusing on asset sales, debt refinancing, and portfolio simplification, communicating primarily through SEC filings rather than mainstream analyst coverage. US investors interested in TCI should be aware of its low liquidity, high concentration risk, and complex structure, requiring in-depth due diligence beyond standard market metrics.
2026-02-13 10:27:10
Transcontinental Realty Investors (NYSE:TCI) recently saw its stock price rise above its 200-day moving average of $48.04, trading as high as $54.56. The company, a publicly traded REIT specializing in retail shopping centers, has a current market capitalization of $470.2 million and a high P/E ratio of 85.04. Analysts maintain a "Hold" rating, and several institutional investors have modestly increased or initiated positions in the stock.
2026-02-05 09:38:20
Transcontinental Realty Investors (NYSE:TCI) saw its share price cross above its 200-day moving average, trading at $55.95, while analysts maintain a "Hold" rating due to a high P/E ratio despite increasing institutional interest. The real estate investment trust reported modest quarterly earnings and revenue, with Russell Investments and other firms boosting their stakes. Investors are advised to consider analyst consensus and fundamental metrics before making a decision.

