

Skywater Technology Inc
$ 31.39
7.87%
14 Apr - close price
- Market Cap 1,415,007,000 USD
- Current Price $ 31.39
- High / Low $ 32.00 / 29.81
- Stock P/E 11.93
- Book Value 3.86
- EPS 2.44
- Next Earning Report 2026-05-06
- Dividend Per Share N/A
- Dividend Yield 0 %
- Next Dividend Date -
- ROA N/A %
- ROE 0.96 %
- 52 Week High 36.27
- 52 Week Low 6.34
About
SkyWater Technology, Inc. manufactures integrated circuits. The company is headquartered in Bloomington, Minnesota.
Analyst Target Price
$35.00
Quarterly Earnings
| Dec 2025 | Sep 2025 | Jun 2025 | Mar 2025 | Dec 2024 | Sep 2024 | Jun 2024 | Mar 2024 | Dec 2023 | Sep 2023 | Jun 2023 | Mar 2023 | |
|---|---|---|---|---|---|---|---|---|---|---|---|---|
| Reported Date | 2026-02-25 | 2025-11-05 | 2025-08-06 | 2025-05-06 | 2025-02-24 | 2024-11-07 | 2024-08-07 | 2024-05-08 | 2024-02-26 | 2023-11-08 | 2023-08-07 | 2023-05-08 |
| Reported EPS | -0.03 | 0.24 | -0.11 | -0.08 | 0.04 | 0.08 | 0.02 | -0.08 | -0.02 | -0.04 | -0.14 | -0.06 |
| Estimated EPS | -0.02 | -0.17 | -0.18 | -0.128 | -0.0425 | -0.02 | -0.11 | -0.05 | -0.12 | -0.16 | -0.11 | -0.13 |
| Surprise | -0.01 | 0.41 | 0.07 | 0.048 | 0.0825 | 0.1 | 0.13 | -0.03 | 0.1 | 0.12 | -0.03 | 0.07 |
| Surprise Percentage | -50% | 241.1765% | 38.8889% | 37.5% | 194.1176% | 500% | 118.1818% | -60% | 83.3333% | 75% | -27.2727% | 53.8462% |
Next Quarterly Earnings
| Mar 2026 | |
|---|---|
| Reported Date | 2026-05-06 |
| Fiscal Date Ending | 2026-03-31 |
| Estimated EPS | -0.12 |
| Currency | USD |
Next Dividend Records
| Dividend per share (year): | - |
| Dividend Yield | - |
| Next Dividend Date | - |
| Ex-Dividend Date | - |
Recent News: SKYT

2026-04-14 20:14:57
SkyWater Technology, Inc.'s Board of Directors has unanimously recommended that stockholders vote FOR the proposed merger with IonQ, Inc. The Special Meeting for this vote is scheduled for May 8, 2026, and the Registration Statement on Form S-4 for the merger was declared effective on March 31, 2026. Stockholders are urged to vote promptly, as failing to do so will be equivalent to a vote against the merger.
2026-04-14 09:23:00
Tudor Investment Corp ET AL has acquired a new stake of 64,420 shares in SkyWater Technology (NASDAQ:SKYT), valued at approximately $1.2 million. This investment signals potential institutional confidence in the specialty semiconductor manufacturer's growth prospects. The company is a U.S.-based specialty semiconductor foundry headquartered in Bloomington, Minnesota.
2026-04-14 09:09:57
Tudor Investment Corp ET AL has acquired a new stake of 64,420 shares in SkyWater Technology (NASDAQ:SKYT) during the third quarter, valued at approximately $1.20 million. Despite this new institutional investment, analysts have a "Reduce" consensus rating with a $32.00 average price target, reflecting mixed views. Additionally, CFO Steve Manko recently sold 91,109 shares, reducing his position by nearly 30%, though insiders still collectively own a significant 37.85% of the company.

2026-04-14 07:35:00
Baillie Gifford & Co., a major institutional investor, decreased its stake in SkyWater Technology (NASDAQ:SKYT) by 3.8% in Q4 2025, selling 62,554 shares. The firm now holds 1.56 million shares, valued at $28.4 million. This reduction, though small, might indicate shifting investor sentiment despite the company's strong overall institutional backing and promising long-term prospects.
2026-04-12 15:02:00
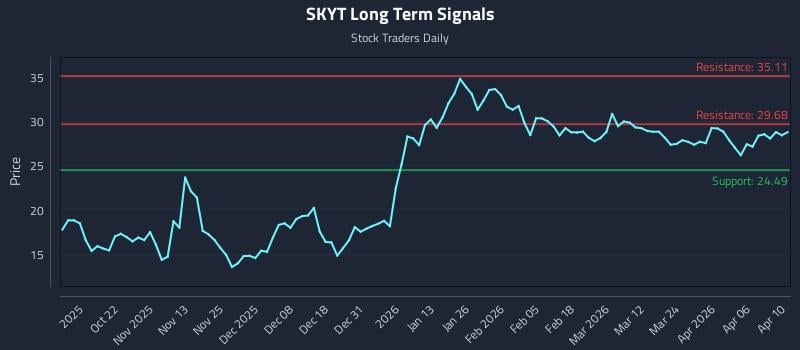
This article provides a real-time analysis of Skywater Technology Inc. (NASDAQ: SKYT) stock movement based on AI models. It highlights strong near-term sentiment, a mid-channel oscillation pattern, and an exceptional risk-reward short setup. The analysis includes three distinct trading strategies for different risk profiles and multi-timeframe signal analysis.
2026-04-10 08:09:42
SkyWater Technology (SKYT) is seeing renewed investor interest due to expectations of a significant 139.8% revenue increase, despite an unchanging EPS loss forecast. This comes amidst analyst estimate revisions and a shift to a Zacks Rank of #5 (Strong Sell). The article suggests that these shifts and the potential impact of the pending IonQ acquisition could reshape the investment outlook for SKYT.

