

PRA Group Inc
$ 16.01
6.45%
05 Jun - close price
- Market Cap 573,639,000 USD
- Current Price $ 16.01
- High / Low $ 16.04 / 15.07
- Stock P/E N/A
- Book Value 26.28
- EPS -7.15
- Next Earning Report 2026-08-10
- Dividend Per Share N/A
- Dividend Yield 0 %
- Next Dividend Date -
- ROA 0.05 %
- ROE -0.23 %
- 52 Week High 22.55
- 52 Week Low 10.25
About
PRA Group, Inc., a service company, is engaged in the purchase, collection and management of delinquent loan portfolios in the Americas, Australia and Europe. The company is headquartered in Norfolk, Virginia.
Analyst Target Price
$26.00
Quarterly Earnings
| Mar 2026 | Dec 2025 | Sep 2025 | Jun 2025 | Mar 2025 | Dec 2024 | Sep 2024 | Jun 2024 | Mar 2024 | Dec 2023 | Sep 2023 | Jun 2023 | |
|---|---|---|---|---|---|---|---|---|---|---|---|---|
| Reported Date | 2026-05-07 | 2026-02-26 | 2025-11-03 | 2025-08-04 | 2025-05-05 | 2025-02-19 | 2024-11-04 | 2024-08-05 | 2024-05-06 | 2024-02-15 | 2023-11-06 | 2023-08-07 |
| Reported EPS | 0.73 | 1.46 | -10.43 | 0.35 | 0.09 | 0.47 | 0.49 | 0.54 | 0.09 | -0.22 | -0.31 | -0.1 |
| Estimated EPS | 0.51 | 0.31 | 0.37 | 0.62 | 0.41 | 0.4467 | 0.34 | 0.05 | -0.15 | -0.35 | -0.38 | -0.12 |
| Surprise | 0.22 | 1.15 | -10.8 | -0.27 | -0.32 | 0.0233 | 0.15 | 0.49 | 0.24 | 0.13 | 0.07 | 0.02 |
| Surprise Percentage | 43.1373% | 370.9677% | -2918.9189% | -43.5484% | -78.0488% | 5.216% | 44.1176% | 980% | 160% | 37.1429% | 18.4211% | 16.6667% |
Next Quarterly Earnings
| Jun 2026 | |
|---|---|
| Reported Date | 2026-08-10 |
| Fiscal Date Ending | 2026-06-30 |
| Estimated EPS | 0.53 |
| Currency | USD |
Previous Dividend Records
| Jan 1970 | |
|---|---|
| Payment Date | None |
| Amount | $1.0 |
Next Dividend Records
| Dividend per share (year): | - |
| Dividend Yield | - |
| Next Dividend Date | - |
| Ex-Dividend Date | - |
Recent News: PRAA
2026-06-02 04:38:00
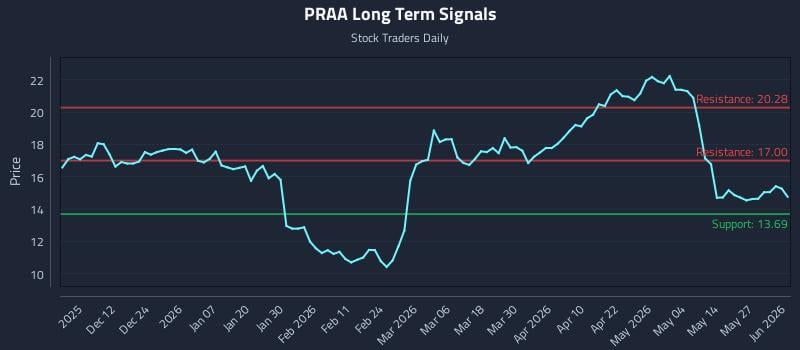
An AI-driven analysis indicates that Pra Group Inc. (PRAA) has a precise trading setup with an exceptional 82.8:1 risk-reward ratio, targeting a 24.2% gain against a 0.3% risk. The sentiment is positive near-term, weakening mid-term, but strong long-term, driven by a mid-channel oscillation pattern. The report provides detailed institutional trading strategies for various risk profiles, including position trading, momentum breakout, and risk hedging, along with multi-timeframe signal analysis.
2026-06-01 17:40:33
The Colorado Supreme Court ruled in Wright v. Portfolio Recovery Associates that affidavits cannot rectify a defective debt assignment. This decision impacts the accounts receivable management industry, particularly concerning debt buyers and state law requirements for debt assignment documentation. The article, part of ACA International's Daily Decision series, highlights the ongoing legal complexities in debt recovery.
2026-05-22 09:11:45
Fitch Ratings has affirmed PRA Group Inc.'s Long-Term Issuer Default Rating (IDR) and senior unsecured debt ratings at 'BB', maintaining a Stable Outlook. This affirmation reflects PRA's global presence, improved operating metrics, and adequate liquidity, despite elevated cash flow leverage. The company's "PRA 3.0" strategy aims for sustained profitability and leverage reduction, though execution risks remain.

2026-05-19 21:09:56
PRA Group Inc is under investor scrutiny following its latest quarterly results and a strategic update on its debt purchasing and cost structure. The company, a specialty finance firm focused on nonperforming consumer debt, operates across the US and Europe, navigating a high interest rate environment and changing consumer behaviors. Its performance is tied to portfolio acquisition volume, recovery rates, and operating costs, offering US investors a unique exposure to the consumer credit market.

2026-05-17 18:36:12
PRA Group Inc, a US debt buyer, reported weaker quarterly earnings but announced a new $100 million share repurchase program. The company specializes in purchasing and collecting nonperforming consumer loans, and its profitability is influenced by consumer payment behavior, macroeconomic conditions, and interest rates. Management is focusing on selective portfolio purchases, technology investments, and returning capital to shareholders through the buyback program.

2026-05-12 08:10:27
PRA Group (PRAA) reported exceptional Q1 2026 results, with EPS of $0.73 significantly surpassing the forecast of $0.07, and revenue reaching $314.53 million against an anticipated $295.25 million. Despite this strong financial performance, the company's stock experienced a 9.91% dip in after-hours trading. The company's CEO, Kevin Stevenson, highlighted successful execution of strategic initiatives in digital transformation and legal collections, emphasizing a focus on long-term growth and efficiency improvements.

