

Ranpak Holdings Corp
$ 5.43
-1.27%
06 Aug - close price
- Market Cap 471,671,000 USD
- Current Price $ 5.43
- High / Low $ 5.52 / 5.33
- Stock P/E N/A
- Book Value 6.06
- EPS -0.43
- Next Earning Report -
- Dividend Per Share N/A
- Dividend Yield 0 %
- Next Dividend Date -
- ROA N/A %
- ROE -0.07 %
- 52 Week High 7.81
- 52 Week Low 3.22
About
Ranpak Holdings Corp. The company is headquartered in Concord Township, Ohio.
Analyst Target Price
$7.08
Quarterly Earnings
| Jun 2026 | Mar 2026 | Dec 2025 | Sep 2025 | Jun 2025 | Mar 2025 | Dec 2024 | Sep 2024 | Jun 2024 | Mar 2024 | Dec 2023 | Sep 2023 | |
|---|---|---|---|---|---|---|---|---|---|---|---|---|
| Reported Date | 2026-07-30 | 2026-04-30 | 2026-03-05 | 2025-10-30 | 2025-08-05 | 2025-05-06 | 2025-03-06 | 2024-10-31 | 2024-08-01 | 2024-05-02 | 2024-03-11 | 2023-10-31 |
| Reported EPS | -0.09 | -0.07 | -0.0379 | -0.06 | -0.08 | -0.08 | -0.0009 | -0.1 | 0.08 | -0.09 | -0.11 | -0.04 |
| Estimated EPS | -0.08 | -0.09 | -0.0167 | -0.03 | 0.04 | -0.04 | -0.02 | -0.04 | -0.05 | -0.04 | -0.04 | 0.05 |
| Surprise | -0.01 | 0.02 | -0.0212 | -0.03 | -0.12 | -0.04 | 0.0191 | -0.06 | 0.13 | -0.05 | -0.07 | -0.09 |
| Surprise Percentage | -12.5% | 22.2222% | -126.9461% | -100% | -300% | -100% | 95.5% | -150% | 260% | -125% | -175% | -180% |
Next Quarterly Earnings
| Reported Date |
| Fiscal Date Ending |
| Estimated EPS |
| Currency |
Next Dividend Records
| Dividend per share (year): | - |
| Dividend Yield | - |
| Next Dividend Date | - |
| Ex-Dividend Date | - |
Recent News: PACK
2026-07-30 15:10:40
Ranpak Holdings Corp. reported a Q2 2026 net revenue of $105.2 million, an increase from $92.3 million in the previous year, primarily driven by growth in automation equipment sales, void-fill, and wrapping products. Despite the revenue growth, the company recorded a net loss of $7.9 million, similar to the prior year, and saw a decrease in cash and cash equivalents, though operating activities generated positive cash flow in the first half of 2026. Automation sales significantly contributed to the overall revenue increase, while cushioning sales experienced a slight decline.
2026-07-30 15:10:40
Ranpak Holdings Corp. reported its second-quarter 2026 financial results, with net revenue increasing 14.0% year-over-year to $105.2 million, or 12.2% on a constant currency basis. The company experienced a net loss of $7.9 million, compared to $7.5 million in the prior year, while Adjusted EBITDA rose by 15.8% to $19.1 million. Growth was notably driven by a significant 139.4% increase in automation product line revenue and a 2.4% rise in PPS volumes, particularly in EMEA.
2026-07-18 15:10:40
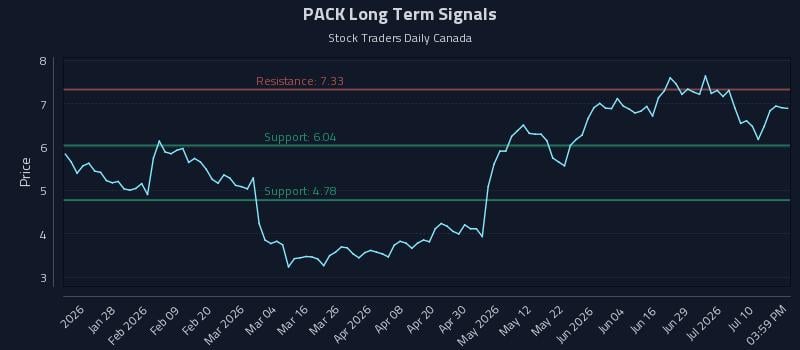
The article analyzes Ranpak Holdings Corp Class A (PACK) using AI models, identifying a near-term positive sentiment, a mid-term weak bias, and long-term strength. It highlights a significant risk-reward short setup and provides three distinct trading strategies: a Long Position Strategy, a Momentum Breakout Strategy, and a Short Risk Hedging Strategy, along with multi-timeframe signal analysis.

2026-07-15 01:11:31
This article lists several ETFs that invest in Ranpak Holdings Corp Class A stocks, sorted by market value. It provides details for each ETF including market value, weight, issuer, management style, focus, expense ratio, AUM, price, and performance metrics. The information aims to help investors find opportunities at potentially lower risk through diversified ETF investments.
2026-07-01 04:02:25
This article provides access to the "Price to earnings forward" financial metric for Ranpak Holdings Corp Class A (FWB:0ZA) on the Frankfurt Stock Exchange via TradingView. It indicates that the market is closed with no current trades. The content primarily serves as a stub for detailed financial data available on the TradingView platform.
2026-06-29 04:40:13
This article provides an overview of Ranpak Holdings Corp Class A (FWB:0ZA) stock, including financial actuals and analyst estimates. It highlights key financial data like earnings per share, revenue, and net income for recent quarters, along with future forecasts. The piece also details the stock's historical price performance, upcoming earnings dates, and general information about the company.

