

OppFi Inc
$ 9.09
2.48%
24 Feb - close price
- Market Cap 793,613,000 USD
- Current Price $ 9.09
- High / Low $ 9.16 / 8.75
- Stock P/E 129.86
- Book Value 1.77
- EPS 0.07
- Next Earning Report 2026-03-04
- Dividend Per Share N/A
- Dividend Yield 0 %
- Next Dividend Date -
- ROA 0.18 %
- ROE 0.49 %
- 52 Week High 15.03
- 52 Week Low 7.31
About
OppFi Inc. is a prominent financial technology company dedicated to delivering consumer lending solutions designed specifically for the underbanked population. Through its innovative proprietary platform, OppFi enhances financial access by offering fair and transparent loans, leveraging advanced data analytics and machine learning for efficient creditworthiness assessments. The company's commitment to responsible lending practices, combined with its focus on growth and innovation in the fintech sector, positions it well to capitalize on emerging market opportunities and expand its offerings, all while improving the financial wellness of its customers. As a publicly traded company, OppFi continues to drive advancements in financial accessibility and consumer empowerment.
Analyst Target Price
$15.17
Quarterly Earnings
| Sep 2025 | Jun 2025 | Mar 2025 | Dec 2024 | Sep 2024 | Jun 2024 | Mar 2024 | Dec 2023 | Sep 2023 | Jun 2023 | Mar 2023 | Dec 2022 | |
|---|---|---|---|---|---|---|---|---|---|---|---|---|
| Reported Date | 2025-10-29 | 2025-08-06 | 2025-05-06 | 2025-03-05 | 2024-11-07 | 2024-08-07 | 2024-05-08 | 2024-03-07 | 2023-11-09 | 2023-08-09 | 2023-05-11 | 2023-03-23 |
| Reported EPS | 0.46 | 0.45 | 0.38 | 0.23 | 0.33 | 0.29 | 0.1 | 0.1 | 0.16 | 0.19 | 0.05 | -0.19 |
| Estimated EPS | 0.3 | 0.3 | 0.2533 | 0.1467 | 0.21 | 0.16 | 0.05 | 0.08 | 0.07 | 0.04 | -0.01 | -0.1 |
| Surprise | 0.16 | 0.15 | 0.1267 | 0.0833 | 0.12 | 0.13 | 0.05 | 0.02 | 0.09 | 0.15 | 0.06 | -0.09 |
| Surprise Percentage | 53.3333% | 50% | 50.0197% | 56.7825% | 57.1429% | 81.25% | 100% | 25% | 128.5714% | 375% | 600% | -90% |
Next Quarterly Earnings
| Dec 2025 | |
|---|---|
| Reported Date | 2026-03-04 |
| Fiscal Date Ending | 2025-12-31 |
| Estimated EPS | 0.28 |
| Currency | USD |
Previous Dividend Records
| Apr 2025 | May 2024 | |
|---|---|---|
| Payment Date | 2025-04-18 | 2024-05-01 |
| Amount | $0.25 | $0.12 |
Next Dividend Records
| Dividend per share (year): | - |
| Dividend Yield | - |
| Next Dividend Date | - |
| Ex-Dividend Date | - |
Recent News: OPFI
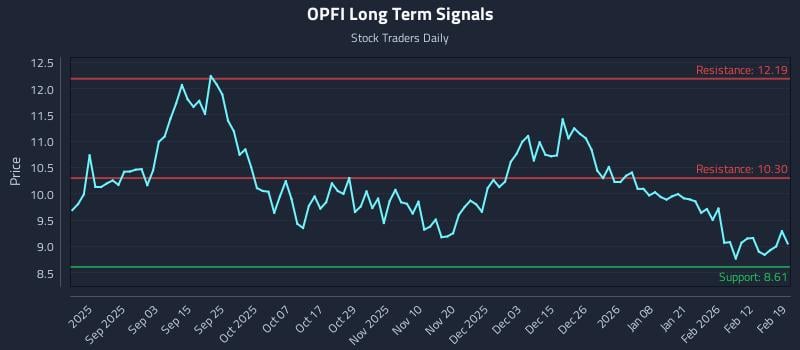
2026-02-19 22:04:00
This article analyzes Oppfi Inc. Class A (NASDAQ: OPFI) trends, highlighting divergent sentiment indicators and a mid-channel oscillation pattern. It presents an exceptional risk-reward setup with a target gain of 19.6% and outlines three distinct AI-generated trading strategies for various risk profiles, including position trading, momentum breakout, and risk hedging strategies. The analysis also includes multi-timeframe signal analysis with support and resistance levels.
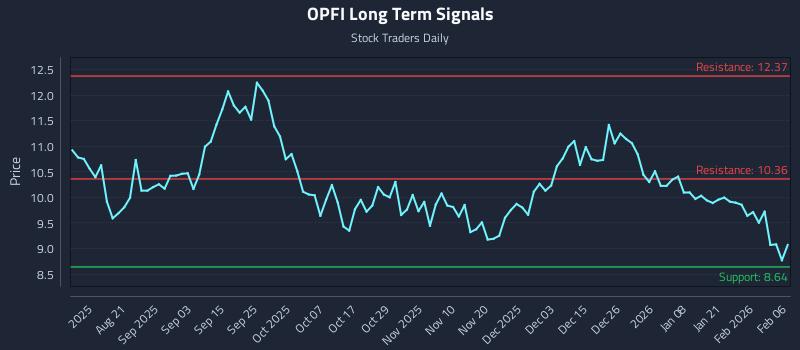
2026-02-08 20:56:00
This article analyzes Oppfi Inc. Class A (NASDAQ: OPFI), highlighting weak near and mid-term sentiment but a neutral long-term outlook. It presents three AI-generated trading strategies—Position, Momentum Breakout, and Risk Hedging—with specific entry, target, and stop-loss levels. The analysis emphasizes an exceptional risk-reward setup targeting a 19.9% gain versus 0.2% risk within a mid-channel oscillation pattern.
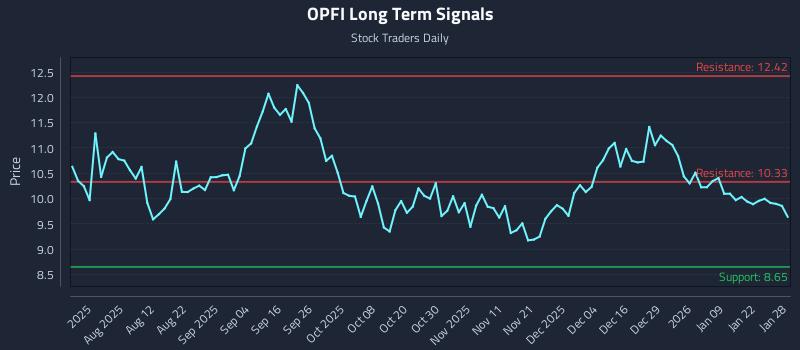
2026-01-28 19:48:00
This article analyzes Oppfi Inc. Class A (NASDAQ: OPFI), identifying weak near and mid-term sentiment, potentially pressuring a neutral long-term outlook. It highlights a significant 56.0:1 risk-reward short setup and provides specific institutional trading strategies, including long, breakout, and short positions with target and stop-loss zones based on AI-generated signals. The analysis also details multi-timeframe signal strengths, support, and resistance levels for the stock.
2026-01-20 14:58:03
OppFi Inc. (NYSE:OPFI) has an average "Hold" rating from six brokerages, with an average 1-year price target of $13.63. The company recently reported strong quarterly earnings, beating estimates with $0.46 EPS and forecasting $1.54-$1.60 EPS for FY2025. Despite recent insider selling, institutional ownership is around 7.1%, with Goldman Sachs Group Inc. notably increasing its stake.
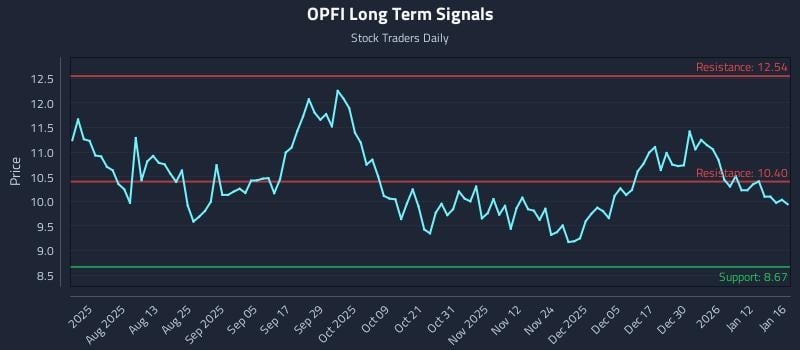
2026-01-17 18:40:00
This article provides a price-driven insight for Oppfi Inc. Class A (NASDAQ: OPFI) for rule-based trading strategies. It highlights weak near- and mid-term sentiment, a neutral long-term outlook, and details specific institutional trading strategies including long, momentum breakout, and short positions with defined entry, target, and stop-loss zones. The analysis also includes AI-generated signals and multi-timeframe signal strengths with support and resistance levels.
2026-01-06 17:32:00
The article analyzes Oppfi Inc. Class A (NASDAQ: OPFI) revealing weak near- and mid-term sentiment but a neutral long-term outlook. It identifies a mid-channel oscillation pattern and highlights an exceptional 58.3:1 risk-reward short setup, targeting 16.7% downside with minimal risk. The analysis also provides AI-generated trading strategies for various risk profiles, including position trading, momentum breakout, and risk hedging strategies.

