

Madison Square Garden Sports Corp
$ 384.68
-2.29%
12 Jun - close price
- Market Cap 9,261,597,000 USD
- Current Price $ 384.68
- High / Low $ 397.00 / 376.52
- Stock P/E N/A
- Book Value -12.27
- EPS -0.92
- Next Earning Report 2026-08-12
- Dividend Per Share N/A
- Dividend Yield 0 %
- Next Dividend Date -
- ROA -0.01 %
- ROE -0.12 %
- 52 Week High 397.00
- 52 Week Low 186.21
About
Madison Square Garden Sports Corp. The company is headquartered in New York, New York.
Analyst Target Price
$398.17
Quarterly Earnings
| Mar 2026 | Dec 2025 | Sep 2025 | Jun 2025 | Mar 2025 | Dec 2024 | Sep 2024 | Jun 2024 | Mar 2024 | Dec 2023 | Sep 2023 | Jun 2023 | |
|---|---|---|---|---|---|---|---|---|---|---|---|---|
| Reported Date | 2026-05-08 | 2026-02-05 | 2025-10-31 | 2025-08-12 | 2025-05-02 | 2025-02-04 | 2024-11-01 | 2024-08-13 | 2024-05-02 | 2024-02-06 | 2023-11-02 | 2023-08-17 |
| Reported EPS | -0.78 | 0.34 | -0.37 | -0.07 | -0.59 | 0.05 | -0.31 | 1.06 | 1.57 | 0.59 | -0.79 | -0.39 |
| Estimated EPS | 0.52 | 0.43 | -0.92 | -0.34 | 1.48 | 0.32 | -0.78 | 0.11 | 2.77 | 0.45 | -1.52 | -0.11 |
| Surprise | -1.3 | -0.09 | 0.55 | 0.27 | -2.07 | -0.27 | 0.47 | 0.95 | -1.2 | 0.14 | 0.73 | -0.28 |
| Surprise Percentage | -250% | -20.9302% | 59.7826% | 79.4118% | -139.8649% | -84.375% | 60.2564% | 863.6364% | -43.3213% | 31.1111% | 48.0263% | -254.5455% |
Next Quarterly Earnings
| Jun 2026 | |
|---|---|
| Reported Date | 2026-08-12 |
| Fiscal Date Ending | 2026-06-30 |
| Estimated EPS | 0.53 |
| Currency | USD |
Previous Dividend Records
| Jan 1970 | Jan 1970 | |
|---|---|---|
| Payment Date | None | None |
| Amount | $7.0 | $68.06 |
Next Dividend Records
| Dividend per share (year): | - |
| Dividend Yield | - |
| Next Dividend Date | - |
| Ex-Dividend Date | - |
Recent News: MSGS
2026-06-07 19:10:29
This article focuses on the quick ratio of Madison Square Garden Sports Corp. Class A (XETR:MS8). It provides a high-level overview within the context of TradingView's financial data offerings for the stock market. The main content indicates a display for the quick ratio, its value, and percentage change over a given period, although specific figures are not present in this extracted content.
2026-06-06 20:38:52
The article reports on the discontinued operations of Madison Square Garden Sports Corp. Class A, traded under the symbol MS8 on the Deutsche Borse Xetra. It provides basic financial information and market data for the company. The content appears to be a financial data page from TradingView.
2026-06-06 20:09:38
This article provides financial information for Madison Square Garden Sports Corp. Class A (XETR:MS8), specifically focusing on its Return on Assets percentage. It indicates that the market is closed and offers navigation to various financial data and community features on the TradingView platform.
2026-06-06 16:11:11
This article compiles several trading ideas for Madison Square Garden Sports Corp. (XETR:MS8, NYSE:MSGS) from various analysts on TradingView. The ideas primarily suggest long positions, citing reasons like the company's valuable assets (Knicks & Rangers), strong balance sheet, potential for buybacks, and favorable technical indicators. Traders like yieldzilla888 and ShakeShakeLeg provide detailed technical setups, while others offer short-term "Buy Today Sell Tomorrow" (BTST) strategies.
2026-06-06 16:09:38
The article provides a snapshot of Madison Square Garden Sports Corp. Class A's cash flow (XETR:MS8). It details the free cash flow for Q3 2026 as 51.05M EUR and for 2025 as 74.69M EUR, with operating cash flow in 2025 at 77.77M EUR. The page also presents historical cash flow data across operating, investing, and financing activities from 2013 to 2025.
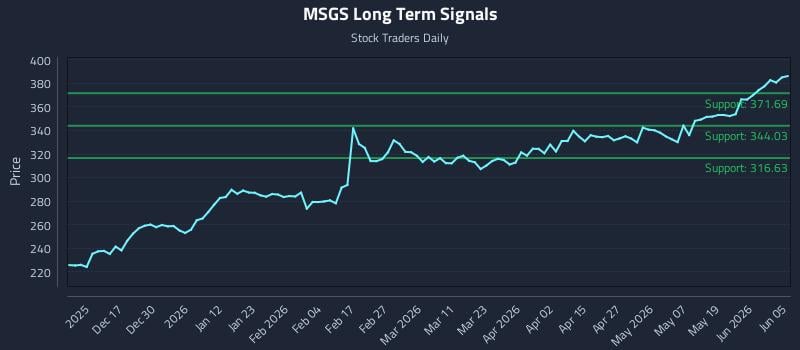
2026-06-05 17:44:00
This article from Stock Traders Daily outlines precision trading strategies for Madison Square Garden Sports Corp. Class A (MSGS), using AI-generated signals for different risk profiles. It identifies strong sentiment across all horizons supporting an overweight bias and provides specific entry, target, and stop-loss zones for long, breakout, and short strategies. The analysis includes multi-timeframe signal strengths and support/resistance levels.

