

J W Mays Inc
$ 41.60
0.00%
12 Jun - close price
- Market Cap 83,856,000 USD
- Current Price $ 41.60
- High / Low $ 41.60 / 41.60
- Stock P/E N/A
- Book Value 25.76
- EPS -0.58
- Next Earning Report -
- Dividend Per Share N/A
- Dividend Yield 0 %
- Next Dividend Date -
- ROA -0.01 %
- ROE -0.02 %
- 52 Week High 61.99
- 52 Week Low 37.40
About
JW Mays, Inc. owns, operates and leases commercial real estate in the United States. The company is headquartered in Brooklyn, New York.
Analyst Target Price
N/A
Quarterly Earnings
| Jan 2026 | Oct 2025 | Jul 2025 | Apr 2025 | Jan 2025 | Oct 2024 | Jul 2024 | Apr 2024 | Jan 2024 | Oct 2023 | Jul 2023 | Apr 2023 | |
|---|---|---|---|---|---|---|---|---|---|---|---|---|
| Reported Date | 2026-03-12 | 2025-12-11 | 2025-10-23 | 2025-06-12 | 2025-03-13 | 2024-12-12 | 2024-10-24 | 2024-06-13 | 2024-03-14 | 2023-12-07 | 2023-10-19 | 2023-06-08 |
| Reported EPS | -0.2525 | -0.17 | -0.05 | 0.04 | -0.0782 | 0.0132 | -0.0154 | -0.0421 | -0.0486 | -0.0955 | -0.0735 | -0.0194 |
| Estimated EPS | 0 | 0 | 0 | None | None | None | None | None | None | 0 | 0 | 0 |
| Surprise | -0.2525 | -0.17 | -0.05 | 0 | 0 | 0 | 0 | 0 | 0 | -0.0955 | -0.0735 | -0.0194 |
| Surprise Percentage | None% | None% | None% | None% | None% | None% | None% | None% | None% | None% | None% | None% |
Next Quarterly Earnings
| Reported Date |
| Fiscal Date Ending |
| Estimated EPS |
| Currency |
Next Dividend Records
| Dividend per share (year): | - |
| Dividend Yield | - |
| Next Dividend Date | - |
| Ex-Dividend Date | - |
Recent News: MAYS
2026-06-12 07:09:11
J. W. Mays, Inc. reported significantly weaker financial results for the three and nine months ended April 30, 2026, as detailed in their 8-K filing. The company experienced reduced revenue and a swing from net income to a substantial net loss for the quarter, and a widened net loss for the nine-month period compared to the previous year. This deterioration in profitability stems from lower sales and increased costs, leading to a negative outlook from equity analysts.
2026-06-11 12:11:09
MAYS J W INC reported its third-quarter fiscal 2026 results, showing a decline in revenue to $5.315 million and a net loss of $(216.9K), resulting in diluted EPS of $(0.11). This performance was primarily attributed to tenant losses and rent concessions, despite some growth from lease escalations and new leasing activities. The company is actively managing its portfolio, including engaging Newmark to market a property and exploring sales to enhance liquidity.
2026-06-11 12:11:09
This article provides a Q3 earnings snapshot for J.W. Mays, indicating that the content is likely a brief financial report detailing key performance indicators for the fiscal quarter. Due to the limited information, specific financial figures or details are not available.
2026-06-11 00:24:00
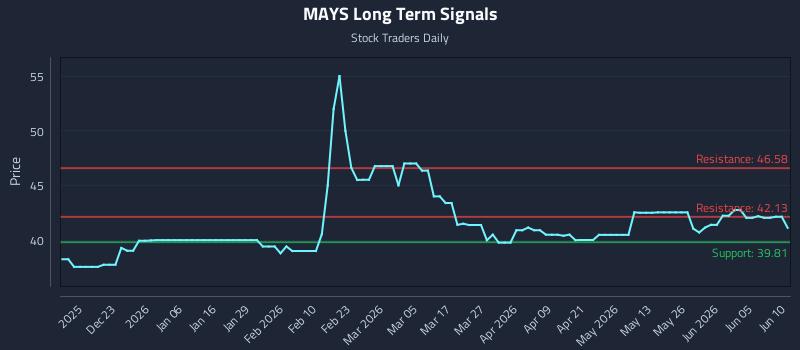
This article analyzes J. W. Mays Inc. (NASDAQ: MAYS) price action, identifying a weak near-term sentiment and a mid-channel oscillation pattern. It presents an exceptional 19.2:1 risk-reward short setup and outlines three AI-generated trading strategies (Position, Momentum Breakout, Risk Hedging) with specific entry, target, and stop-loss levels. The analysis also provides multi-timeframe signal strengths and support/resistance levels for various holding periods.
2026-06-11 00:10:15
J. W. Mays Inc. (NASDAQ: MAYS) is showing weak near-term sentiment, which could lead to bearish positioning with an exceptional 19.2:1 risk-reward short setup. AI models have generated three distinct trading strategies—Position, Momentum Breakout, and Risk Hedging—each with specific entry zones, targets, and stop losses. Multi-timeframe signal analysis indicates varying support and resistance levels across near-term, mid-term, and long-term horizons, suggesting a neutral sentiment overall.
2026-05-30 23:09:36
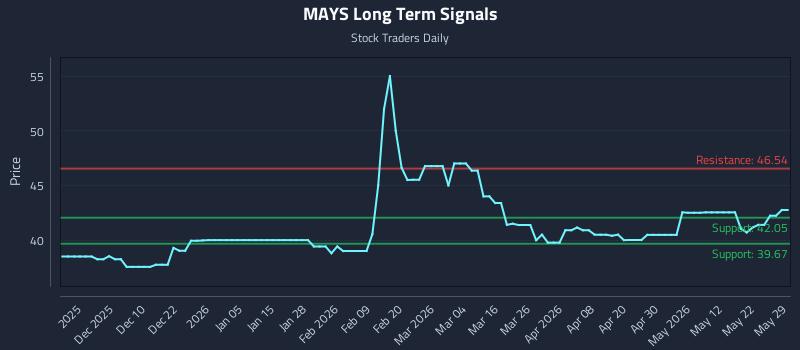
This article analyzes J. W. Mays Inc. (NASDAQ: MAYS), highlighting a near-term strong sentiment despite neutral mid and long-term outlooks, and notes a mid-channel oscillation pattern. It presents an exceptional 37.4:1 risk-reward setup targeting a 10.7% gain against a 0.3% risk. The piece also details three AI-generated trading strategies—Position, Momentum Breakout, and Risk Hedging—with specific entry, target, and stop-loss levels for varying risk profiles.

