

Hingham Institution for Savings
$ 301.57
0.72%
07 Aug - close price
- Market Cap 662,625,000 USD
- Current Price $ 301.57
- High / Low $ 303.62 / 297.01
- Stock P/E 10.04
- Book Value 230.83
- EPS 30.05
- Next Earning Report 2026-10-16
- Dividend Per Share $2.52
- Dividend Yield 0.84 %
- Next Dividend Date 2026-08-12
- ROA 0.01 %
- ROE 0.14 %
- 52 Week High 336.51
- 52 Week Low 236.13
About
Hingham Institution for Savings offers a variety of financial products and services to individuals and businesses in the United States. The company is headquartered in Hingham, Massachusetts.
Analyst Target Price
N/A
Quarterly Earnings
| Jun 2026 | Mar 2026 | Dec 2025 | Sep 2025 | Jun 2025 | Mar 2025 | Dec 2024 | Sep 2024 | Jun 2024 | Mar 2024 | Dec 2023 | Sep 2023 | |
|---|---|---|---|---|---|---|---|---|---|---|---|---|
| Reported Date | 2026-07-17 | 2026-04-17 | 2026-01-16 | 2025-10-10 | 2025-07-11 | 2025-04-11 | 2025-01-17 | 2024-10-11 | 2024-07-12 | 2024-04-12 | 2024-01-19 | 2023-10-13 |
| Reported EPS | 4.82 | 1.2906 | 9.39 | 7.85 | 4.28 | 3.2367 | 5.1658 | 1.44 | 1.8765 | 3.1332 | 2.8862 | 1.5 |
| Estimated EPS | None | None | None | None | 0 | None | None | None | None | None | 0 | None |
| Surprise | 0 | 0 | 0 | 0 | 4.28 | 0 | 0 | 0 | 0 | 0 | 2.8862 | 0 |
| Surprise Percentage | None% | None% | None% | None% | None% | None% | None% | None% | None% | None% | None% | None% |
Next Quarterly Earnings
| Sep 2026 | |
|---|---|
| Reported Date | 2026-10-16 |
| Fiscal Date Ending | 2026-09-30 |
| Estimated EPS | |
| Currency | USD |
Previous Dividend Records
| Aug 2026 | May 2026 | Jan 2026 | Nov 2025 | Aug 2025 | May 2025 | Jan 2025 | Nov 2024 | Aug 2024 | May 2024 | |
|---|---|---|---|---|---|---|---|---|---|---|
| Payment Date | 2026-08-12 | 2026-05-13 | 2026-01-14 | 2025-11-12 | 2025-08-13 | 2025-05-14 | 2025-01-15 | 2024-11-13 | 2024-08-07 | 2024-05-15 |
| Amount | $0.63 | $0.63 | $1.33 | $0.63 | $0.63 | $0.63 | $0.63 | $0.63 | $0.63 | $0.63 |
Next Dividend Records
| Dividend per share (year): | $2.52 |
| Dividend Yield | 0.84% |
| Next Dividend Date | 2026-08-12 |
| Ex-Dividend Date | 2026-08-03 |
Recent News: HIFS

2026-08-08 01:41:24
This article provides an earnings forecast for Hingham Institution For Savings (HIFS), focusing on future EPS and revenue growth estimates. It includes current stock information, market capitalization, P/E ratio, and highlights that the financial forecasting data was updated on August 7, 2026. The content also lists peer comparisons with other major banks.
2026-07-31 12:40:18
Hingham Institution for Savings is scheduled to go ex-dividend on August 3rd, 2026, with a dividend of $0.63 per share. This information is crucial for investors as they need to purchase the stock before this date to be eligible for the upcoming dividend payment.
2026-07-31 09:40:43
Hingham Institution for Savings announced it will go ex-dividend on August 3rd, 2026. Shareholders can expect a dividend of 0.63 USD per share. This information is crucial for investors tracking dividend payouts and ex-dividend dates to ensure eligibility for the upcoming distribution.

2026-07-31 08:40:43
Hingham Institution For Savings (HIFS) has an institutional shareholding score of 7.00, placing it 70th out of 395 in the Banking Services industry. The institutional shareholding proportion is 70.00%, an increase of 2.73% quarter-over-quarter. Chuck Royce is the largest institutional shareholder, holding 5.39% of outstanding shares.
2026-07-30 16:24:00
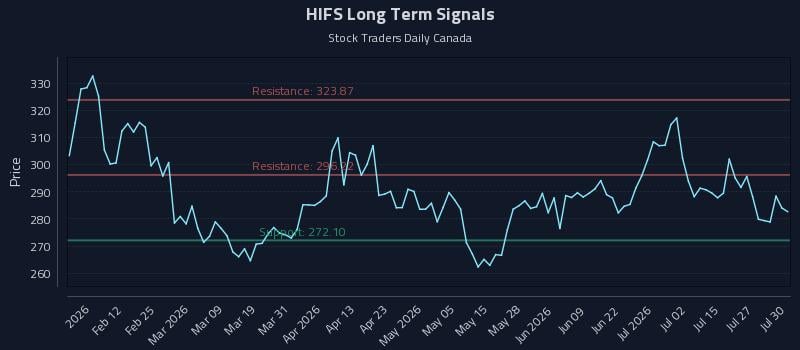
This article provides an in-depth analysis of Hingham Institution For Savings (NASDAQ: HIFS) stock dynamics, highlighting a neutral near-term sentiment that could moderate mid-term weakness. It identifies a mid-channel oscillation pattern and an exceptional 30.5:1 risk-reward setup targeting an 8.9% gain. The piece outlines three AI-generated institutional trading strategies—Position Trading, Momentum Breakout, and Risk Hedging—with specific entry, target, and stop-loss zones.
2026-07-30 06:12:22
The article analyzes the financial health of Hingham Institution For Savings (HIFS), noting its current financial score of 7.88 out of 10, ranking 196th in the Banking Services industry. Despite a weak overall financial status, the company shows high operating efficiency, with significant year-over-year increases in both revenue (109.68%) and net profit (170.27%). However, several key financial metrics like cash and cash equivalents, total assets, total liabilities, free cash flow, operating profit, and income after tax are not yet disclosed by the company.

