

Great Elm Group Inc
$ 2.17
-1.36%
20 Apr - close price
- Market Cap 72,038,000 USD
- Current Price $ 2.17
- High / Low $ 2.19 / 2.07
- Stock P/E N/A
- Book Value 1.79
- EPS -0.49
- Next Earning Report 2026-05-06
- Dividend Per Share N/A
- Dividend Yield 0 %
- Next Dividend Date -
- ROA -0.05 %
- ROE -0.20 %
- 52 Week High 3.51
- 52 Week Low 1.80
About
Great Elm Group, Inc. operates in durable medical equipment, investment management, and real estate businesses. The company is headquartered in Waltham, Massachusetts.
Analyst Target Price
$18.50
Quarterly Earnings
| Dec 2025 | Sep 2025 | Jun 2025 | Mar 2025 | Dec 2024 | Sep 2024 | Jun 2024 | Mar 2024 | Dec 2023 | Sep 2023 | Jun 2023 | Mar 2023 | |
|---|---|---|---|---|---|---|---|---|---|---|---|---|
| Reported Date | 2026-02-04 | 2025-11-10 | 2025-09-02 | 2025-05-06 | 2025-02-11 | 2024-11-06 | 2024-08-29 | 2024-05-08 | 2024-02-13 | 2023-11-08 | 2023-09-20 | 2023-05-05 |
| Reported EPS | -0.5 | -0.2426 | 0.3597 | -0.1671 | 0.0409 | 0.08 | -0.02 | -0.1 | -0.01 | 0.08 | -0.12 | 0.4 |
| Estimated EPS | 0.4 | 0.4 | 0.4 | 0.4 | 0.43 | 0.34 | 0.4 | 0.4 | 0.43 | 0.43 | 0.43 | 0.38 |
| Surprise | -0.9 | -0.6426 | -0.0403 | -0.5671 | -0.3891 | -0.26 | -0.42 | -0.5 | -0.44 | -0.35 | -0.55 | 0.02 |
| Surprise Percentage | -225% | -160.65% | -10.075% | -141.775% | -90.4884% | -76.4706% | -105% | -125% | -102.3256% | -81.3953% | -127.907% | 5.2632% |
Next Quarterly Earnings
| Mar 2026 | |
|---|---|
| Reported Date | 2026-05-06 |
| Fiscal Date Ending | 2026-03-31 |
| Estimated EPS | |
| Currency | USD |
Next Dividend Records
| Dividend per share (year): | - |
| Dividend Yield | - |
| Next Dividend Date | - |
| Ex-Dividend Date | - |
Recent News: GEG
2026-04-15 14:09:39
Great Elm Group, Inc. (NASDAQ:GEG) experienced a significant increase in short interest in March, rising by 40.7% to 215,579 shares, representing 1.3% of its shares shorted. This indicates elevated shorting pressure, with a days-to-cover ratio of 8.6 days. The company reported a loss of ($0.50) EPS, negative return on equity, and negative net margin, leading to a "Sell" rating from Weiss Ratings.
2026-04-07 13:39:29
GEG's technical analysis indicates a "Neutral" sentiment, with its stock currently priced at $2. While some indicators suggest a buy, moving averages and other oscillators point towards a sell or neutral stance. The stock is trading below its 60-day and 200-day moving averages, with key resistance at $2.063 and support at $1.794.
2026-04-05 16:09:39
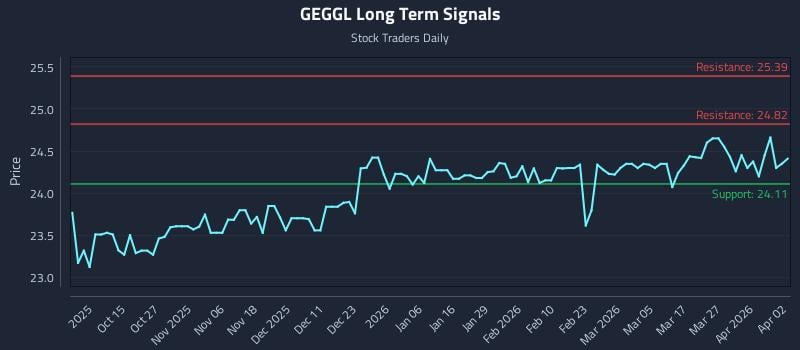
This article provides an AI-generated analysis of Great Elm Group Inc. 7.25% Notes Due 2027 (NASDAQ: GEGGL) for institutional tactics. It highlights a neutral near and mid-term outlook with a possible moderation of a long-term positive bias, noting an exceptional 10.1:1 risk-reward setup. The analysis offers three distinct trading strategies: Position Trading, Momentum Breakout, and Risk Hedging, alongside multi-timeframe signal analysis.
2026-04-03 14:39:39
This article provides financial data for Great Elm Group, Inc. (SWB:PNC), specifically focusing on its free cash flow per share. The information is presented within the TradingView platform, with data sourced from ICE Data Services, FactSet, and Quartr for SEC filings.
2026-04-01 03:40:31
This page on StockTitan provides access to Great Elm Capital Corp (GECCZ) SEC filings, including 10-K, 10-Q, 8-K forms, and insider trading disclosures. Each filing is accompanied by an AI-generated summary, sentiment and impact scores, and end-of-day stock performance data. The platform aims to simplify access to critical regulatory documents for investors and compliance professionals.
2026-03-25 15:10:21
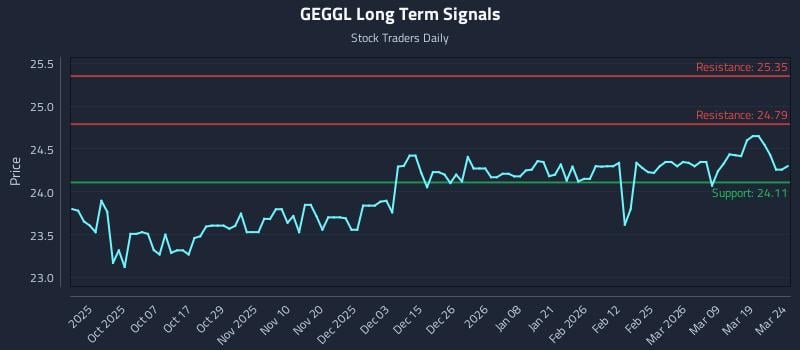
This article provides a detailed AI-driven analysis for Great Elm Group Inc. 7.25% Notes Due 2027 (NASDAQ: GEGGL), identifying a neutral near and mid-term outlook that could moderate a positive long-term bias. It highlights a significant 9.7:1 risk-reward short setup and outlines three distinct trading strategies with specific entry, target, and stop-loss levels for different risk profiles. The analysis is supported by multi-timeframe signal analysis, showing neutral signals in the near and mid-term, but a strong signal for the long-term.

