

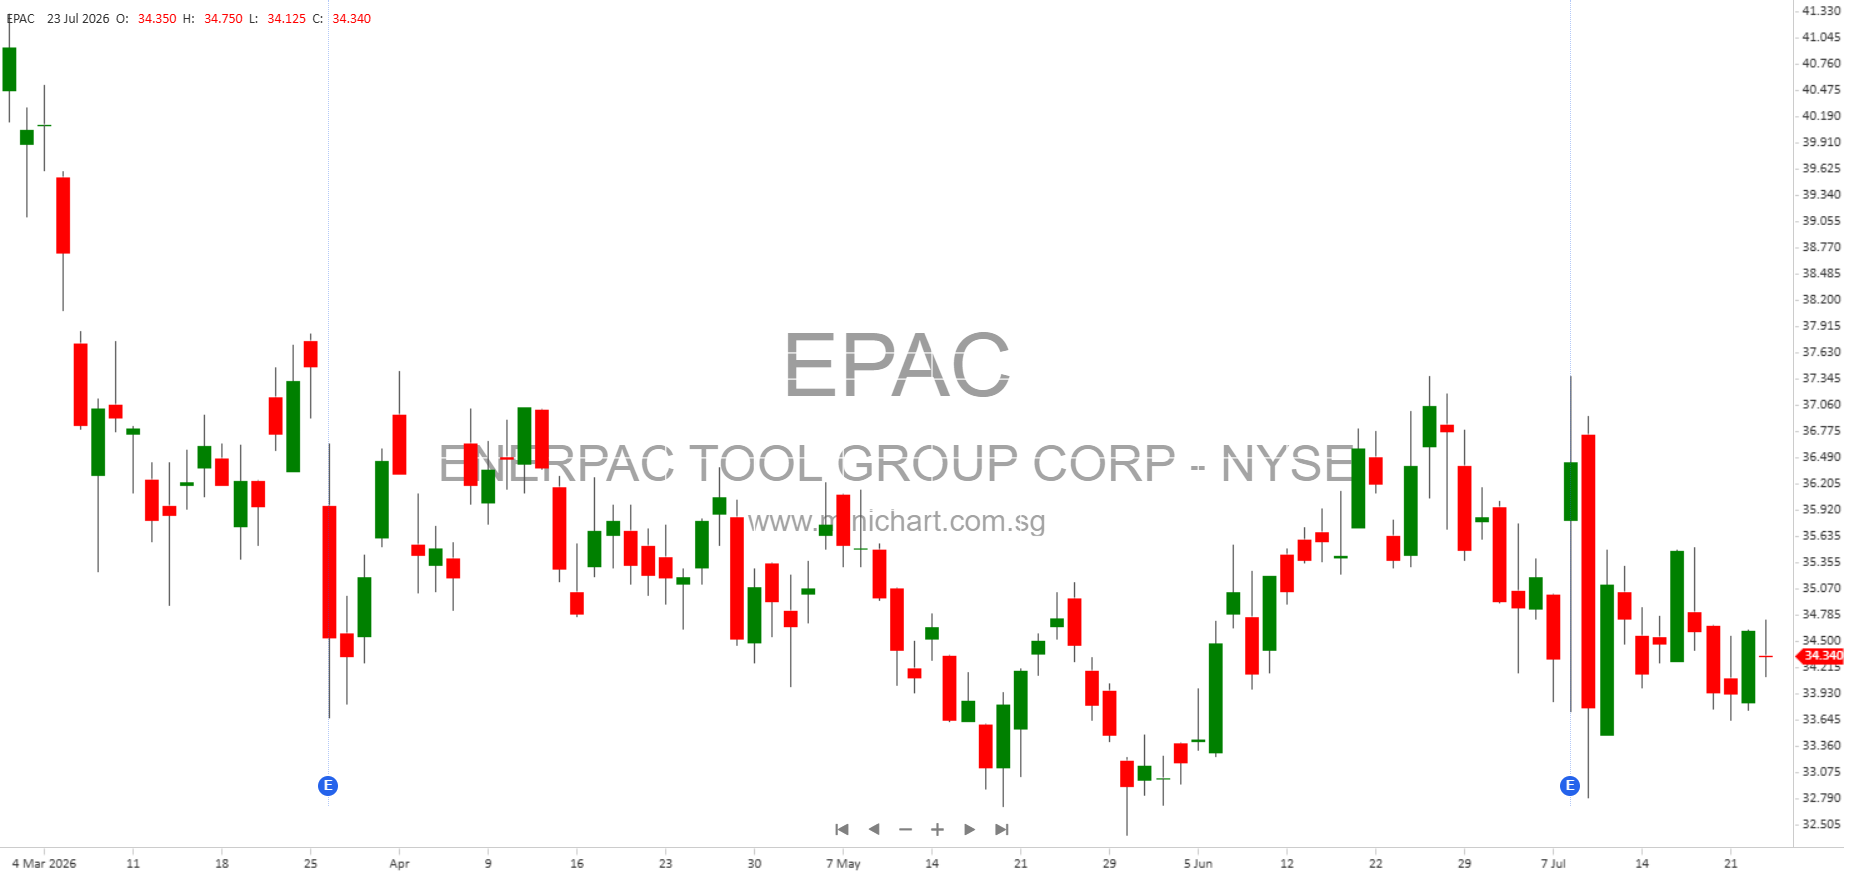
Enerpac Tool Group Corp
$ 37.09
6.34%
28 Jul - close price
- Market Cap 1,797,826,000 USD
- Current Price $ 37.09
- High / Low $ 37.32 / 35.80
- Stock P/E 19.82
- Book Value 7.91
- EPS 1.76
- Next Earning Report 2026-10-14
- Dividend Per Share $0.04
- Dividend Yield 0.12 %
- Next Dividend Date 2026-10-16
- ROA 0.10 %
- ROE 0.22 %
- 52 Week High 45.00
- 52 Week Low 32.35
About
Enerpac Tool Group Corp. The company is headquartered in Menomonee Falls, Wisconsin.
Analyst Target Price
$48.00
Quarterly Earnings
| May 2026 | Feb 2026 | Nov 2025 | Aug 2025 | May 2025 | Feb 2025 | Nov 2024 | Aug 2024 | May 2024 | Feb 2024 | Nov 2023 | Aug 2023 | |
|---|---|---|---|---|---|---|---|---|---|---|---|---|
| Reported Date | 2026-06-25 | 2026-03-25 | 2025-12-17 | 2025-10-15 | 2025-06-26 | 2025-03-24 | 2024-12-18 | 2024-10-15 | 2024-06-24 | 2024-03-20 | 2023-12-19 | 2023-10-16 |
| Reported EPS | 0.6 | 0.39 | 0.36 | 0.52 | 0.51 | 0.39 | 0.4 | 0.5 | 0.47 | 0.36 | 0.39 | 0.37 |
| Estimated EPS | 0.49 | 0.39 | 0.37 | 0.51 | 0.47 | 0.4 | 0.41 | 0.53 | 0.47 | 0.36 | 0.32 | 0.27 |
| Surprise | 0.11 | 0 | -0.01 | 0.01 | 0.04 | -0.01 | -0.01 | -0.03 | 0 | 0 | 0.07 | 0.1 |
| Surprise Percentage | 22.449% | 0% | -2.7027% | 1.9608% | 8.5106% | -2.5% | -2.439% | -5.6604% | 0% | 0% | 21.875% | 37.037% |
Next Quarterly Earnings
| Aug 2026 | |
|---|---|
| Reported Date | 2026-10-14 |
| Fiscal Date Ending | 2026-08-31 |
| Estimated EPS | 0.56 |
| Currency | USD |
Previous Dividend Records
| Oct 2026 | Oct 2025 | Oct 2024 | Oct 2023 | Oct 2022 | Oct 2021 | Oct 2020 | Jan 1970 | Jan 1970 | Jan 1970 | |
|---|---|---|---|---|---|---|---|---|---|---|
| Payment Date | 2026-10-16 | 2025-10-17 | 2024-10-18 | 2023-10-18 | 2022-10-17 | 2021-10-18 | 2020-10-19 | None | None | None |
| Amount | $0.04 | $0.04 | $0.04 | $0.04 | $0.04 | $0.04 | $0.04 | $0.04 | $0.04 | $0.04 |
Next Dividend Records
| Dividend per share (year): | $0.04 |
| Dividend Yield | 0.12% |
| Next Dividend Date | 2026-10-16 |
| Ex-Dividend Date | 2026-10-06 |
Recent News: EPAC
2026-07-27 16:11:07
E. James Ferland Jr., a director at Enerpac Tool Group Corp (NYSE:EPAC), sold 2,930 shares of the company's Class A Common Stock for $100,645 on July 23, 2026, after acquiring them through a stock option exercise. Remaining holdings for Mr. Ferland are 99,681 shares. This transaction follows Enerpac Tool Group's strong fiscal third-quarter results, where the company exceeded Wall Street expectations in earnings and revenue and subsequently raised its growth plans.
2026-07-27 15:11:07
Enerpac Tool Group director E James Jr Ferland exercised stock options for 2,930 shares of Class A Common Stock at $26.95 per share and subsequently sold these shares at $34.35 per share on July 23, 2026. This transaction, generating an approximate pre-tax spread of $22,000, was conducted under a Rule 10b5-1 trading plan. After the sale, Ferland's direct holdings in Class A Common Stock stand at 99,681 shares.
2026-07-27 15:11:07
Enerpac Tool Group director Danny L. Cunningham exercised 2,930 stock options at $26.95 per share and simultaneously sold the same number of shares at $34.35 per share. These transactions, which occurred on July 23, 2026, were executed under a Rule 10b5-1 trading plan. After the transactions, Cunningham holds 24,030 Class A Common Shares and 0 Director Stock Options.
2026-07-25 15:40:35
Enerpac Tool Group Corp Class A (FWB:PW9) generated 528.05 million EUR in revenue last year. The Industrial Tools & Services segment was the top performer, contributing 510.01 million EUR. The United States market was the largest regional contributor, accounting for 196.04 million EUR.
2026-07-25 08:40:36
Enerpac Tool Group Corp. announced the appointment of Kevin J. Hagen as their new Principal Accounting Officer, Vice President, and Global Controller, effective July 23, 2026. Mr. Hagen replaces Patrick J. Dawson. Hagen brings extensive accounting and financial reporting experience from The Sherwin-Williams Company and Signet Jewelers Limited, a move that is considered significant due to its potential impact on financial reporting, regulatory compliance, and investor confidence.

2026-07-24 20:40:33
Enerpac Tool Group (NYSE: EPAC) has declared an annual cash dividend of $0.04 per Class A common share. The dividend will be payable on October 16, 2026, to shareholders of record as of October 6, 2026. This move reflects the board's decision to return a portion of capital to shareholders on a scheduled annual basis.

